2.3. Network clustering
You imported the GBM-altered network into MONGKIE, now you will apply the MCL Network clustering algorithm to identify network modules representing genes with topological proximity and correlated expression.
Hint
In the edge table, you can see that the i.weight column contains expression correlations.
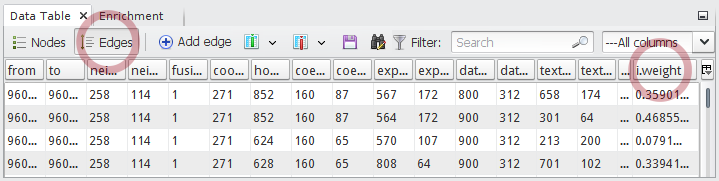
MONGKIE internally assigns the values of i.weight column in a edge table to the weights of edges for clustering. Therfore, to give weights to edges in your network, you should set the name of the column to i.weight.
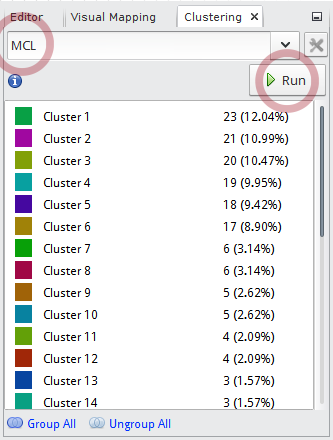
In the Clustering window at the top-left of main application
- Choose the
MCLalgorithm in the drop-down list. - Click the
 button to start the algorithm.
 - After a little, the identified clusters will be listed.
- Choose the
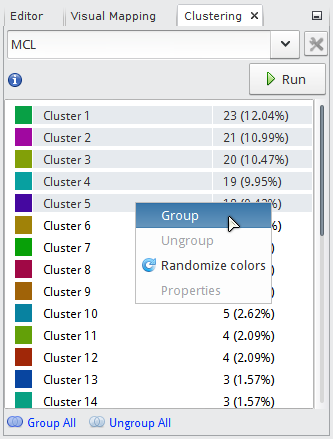
You can define these clusters as group nodes on the network.
- Select top 5 largest clusters by clicking
Cluster 1andCluster 5holding down theShiftkey. - Right-click on the selection will show up a pop-up menu. Click the Group menu item.
- Select top 5 largest clusters by clicking
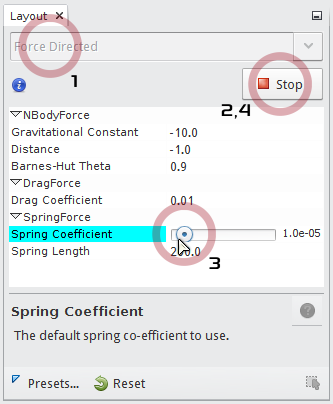
Now you see that group nodes on the network are too large or a lot of overlapping with each other. You can use the force-directed algorithm to lay out them with more optimized size and position.
- In the Layout window at the bottom-left of main application, choose the
Force Directedalgorithm. - Click the bottom to start the algorithm.
- Set
Spring Coefficientto the minimu value4.0E-5by dragging the slider tick to the left-most. - When being satisfied with the result, you can stop the running of algorithm by clicking the
 button.
- In the Layout window at the bottom-left of main application, choose the
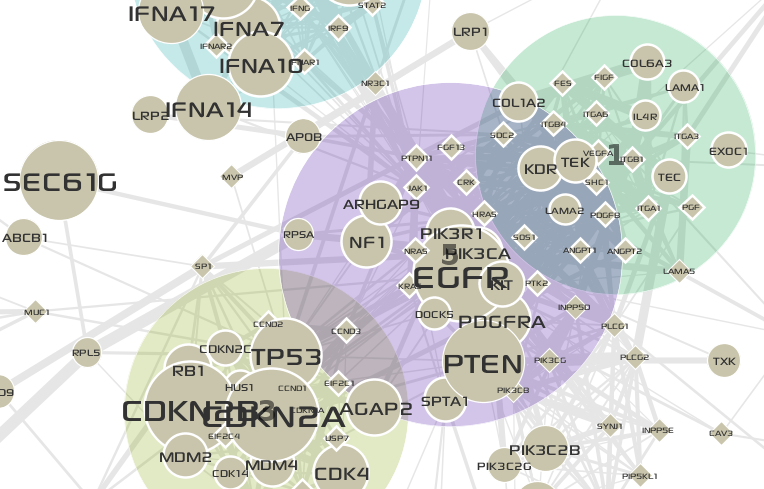
The final network looks like the following:
Tip
How to change default shape of group nodes on the network.
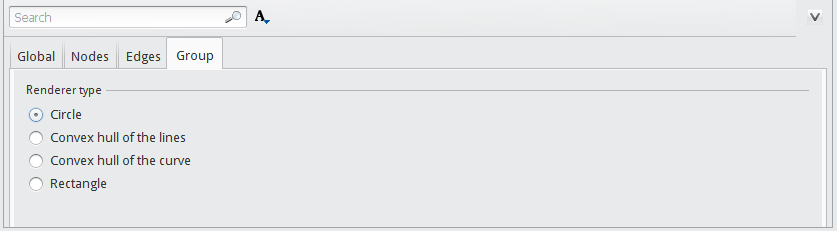
In the Display Options panel, you can globally set various visualization options for nodes, edges, and groups:
- To open the Display Options panel, click the
 button at the bottom-right of a network window.
 - Select the Group tab.
- Choose one of listed shapes.
For editing a individual component, you can use the Visual Editor UI.
Tip
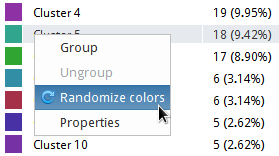
How to change colors of cluster in the Clustering window.
Initially the colors of cluster are assigned randomly. You can regenerate random colors for all clusters:
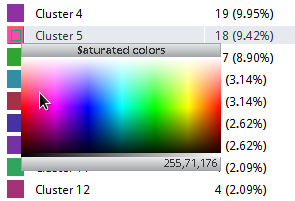
Or, you can manually set the color of individual cluster:
- Press and keep holding down the mouse left-button on the color box on the left of a cluster name.
- While holding the mouse button down, move the pointer in the color panel.
- Press
ALTkey down to show constant colors.- Press
SHIFTkey down to show desaturated colors.- Press both
CTRLandALTkeys down to show recent colors.
- When you release the mouse button, a color under the pointer is set to the cluster’s color.
Of course, you can use the Visual Editor UI for changing the color of group node.
Tip
By double-clicking the name of a cluster listed in the Clustering window, you can edit name of the cluster.