2.6. Functional annotation of a cluster
In this section, you will perform a GO Over-representation analysis for genes in Cluster 3 and visually annotate the cluster with representative functions via the Visual Editor UI.
- Make sure you select the Network tab of
Cluster 3.
- Select the .
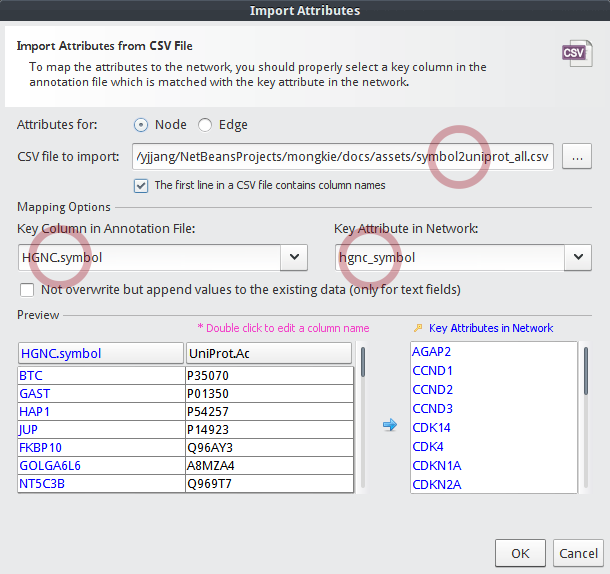
Before going to remaining steps, you need to import
symbol2uniprot_all.csvinto the node table. The reason is that our in-house GO over-representation analysis tool expects IDs of gene set to be UniProt Accessions.- Select as described in previous section.
- In the Import Attributes dialog,
- Choose a CSV file to import:
symbol2uniprot_all.csv - Key Column in Annotation File:
HGNC.symbol - Key Attribute in Network:
hgnc_symbol
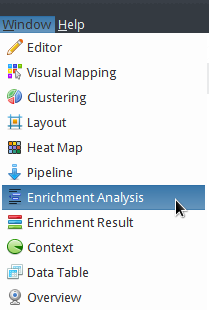
In the Enrichment Analysis window,
- Choose
Gene Ontologyin the drop-down list. - Set Gene ID column to
UniProt.Ac. - Set the multiple testing Correction method to
Bonferroni. - Click the Run button.
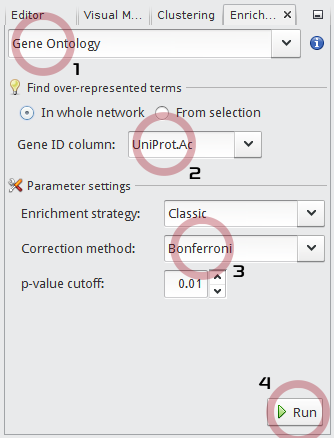
- Choose
After a little, the result is shown in the Enrichment window at the bottom of main application.
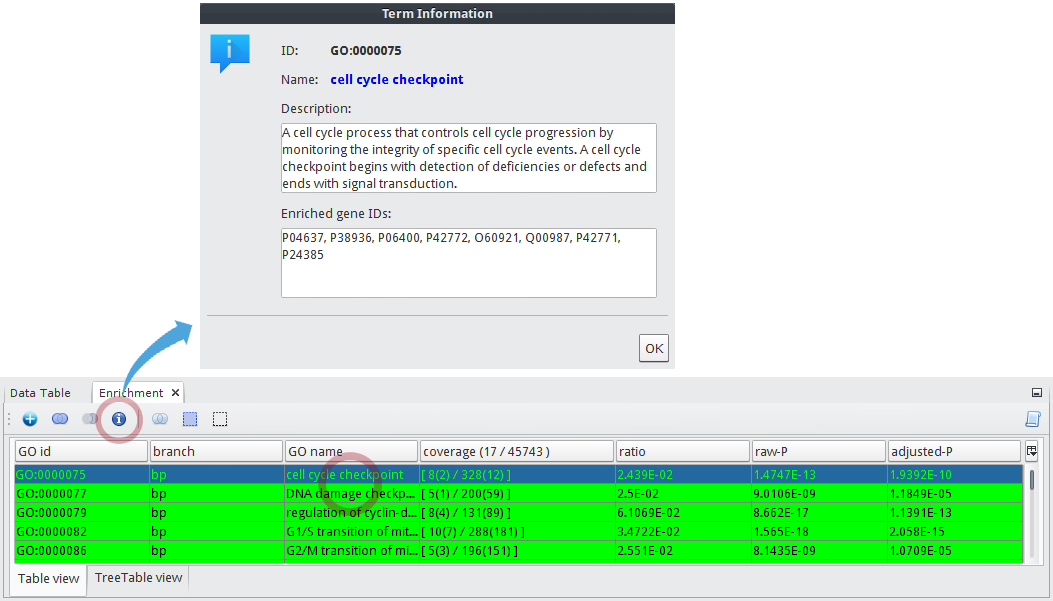
- You can see that GO terms of
cell cycle checkpointandDNA damage checkpointare listed in first and second rows respectively. - Select the
cell cycle checkpointGO term, the click icon to see the details about the term.
- You can see that GO terms of
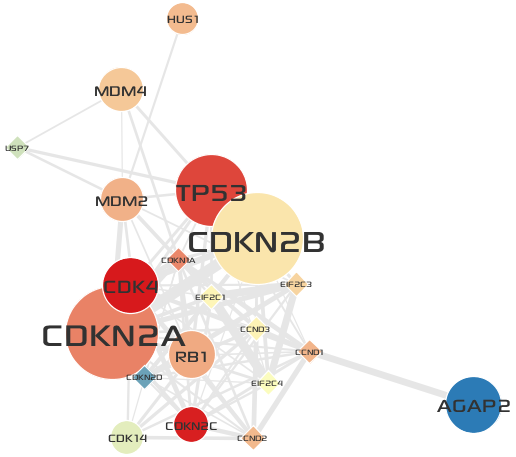
Next you will visually annotate the group node of
Cluster 3with two representative functions.Caution
Now be sure to switch to the original network tab named
tcga_gbm_edges.- Click the group node of cluster
3in the original GBM-altered network. - In the Editor window,
- Click the
...icon in Name property to edit a group name. - Enter
DNA damage responseandCell Cycle. - Set the Font property to
Droid Serif 80 Boldor what you want. (You can open the font chooser by clicking...button in the Font property)
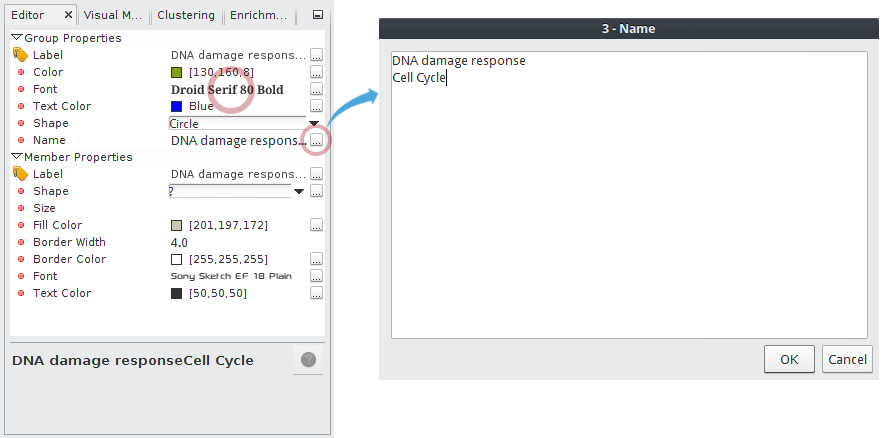
- Click the group node of cluster
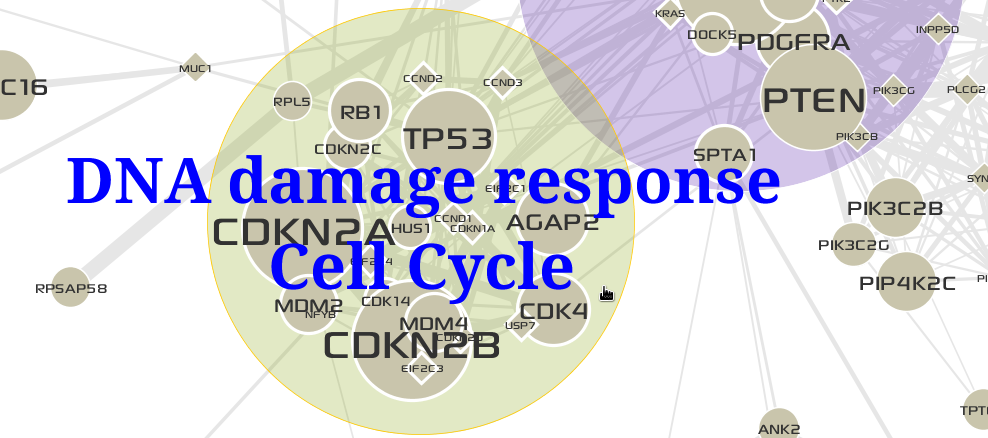
The result is shown below:
Tip
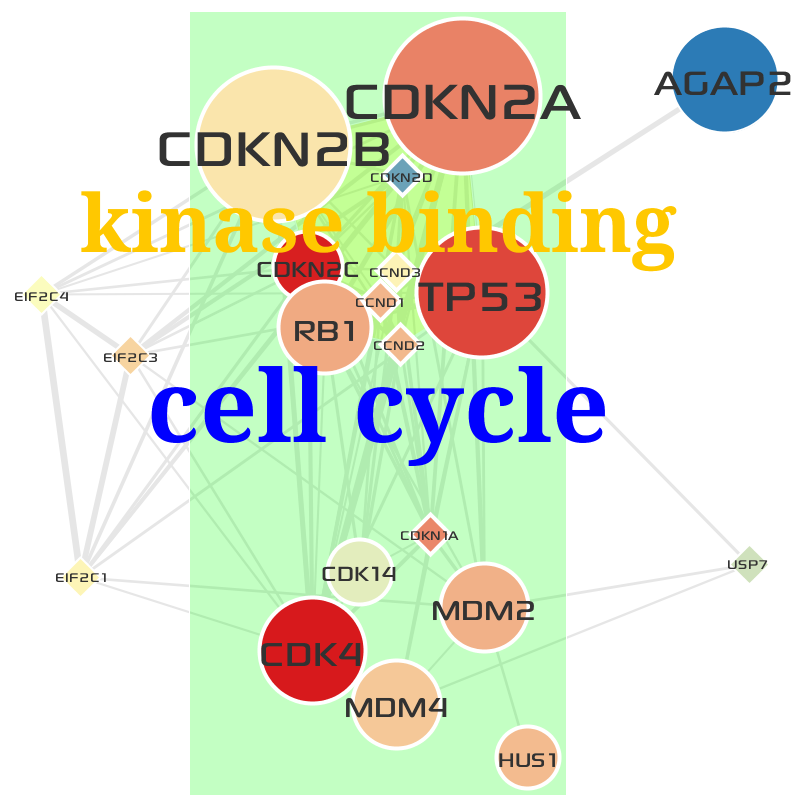
How to define a group node that contains nodes (genes or proteins) with a same function after GO over-representation analysis.
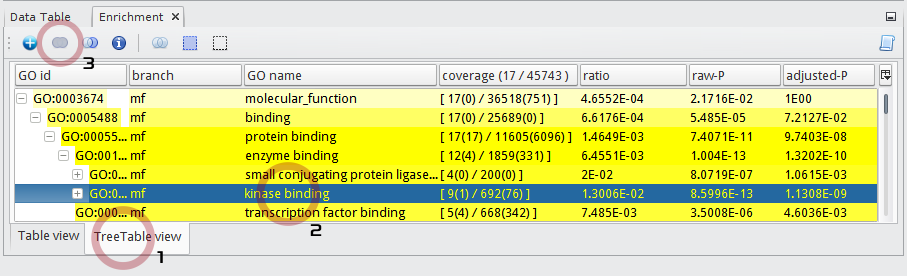
After GO over-representation analysis of Cluster 3:
- Select the TreeTable view tab in the Enrichment result window.
- Select a GO term named kinase binding at
molecular_function > binding > protein binding > enzyme binding > kinase binding. - Click the
 button.
- After clicking the group node named
kinase binding, edit its visual properties in the Editor window.
- Set Font to
Droid Serif 80 Bold.- Set Text Color to
Orange.- Set Shape to
Convex hull of the lines.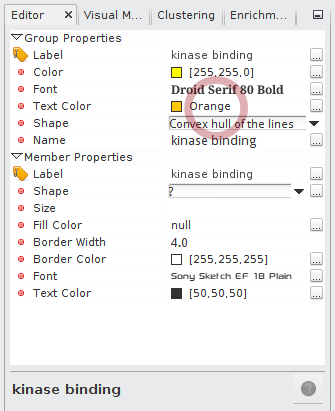
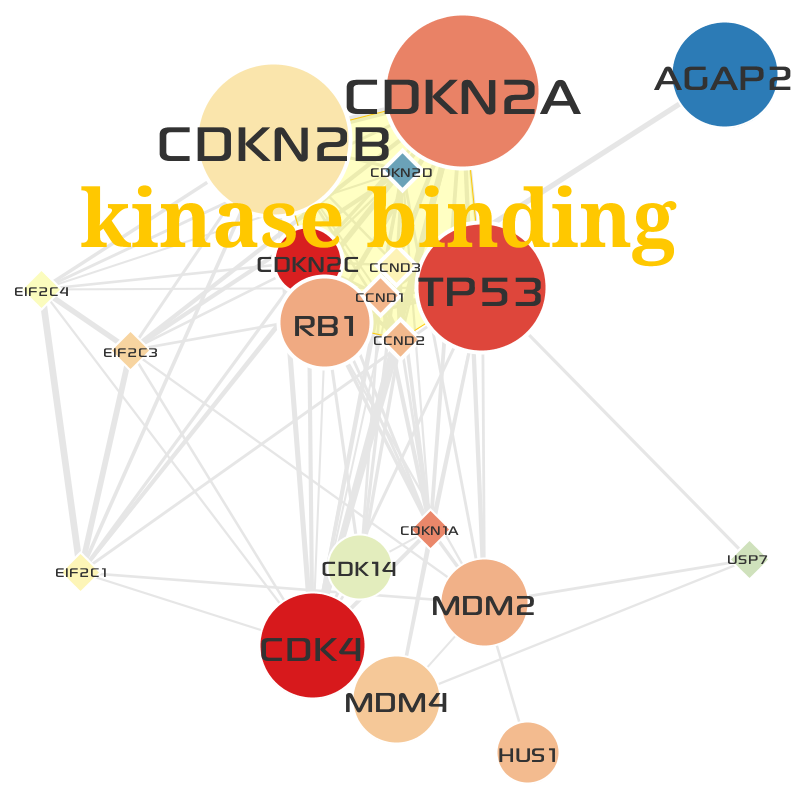
- Manually adjust the positions of nodes like below:
- Select a GO term named cell cycle at
biological_process > cellular process > single-organism cellular process > cell cycle. - Click the button.
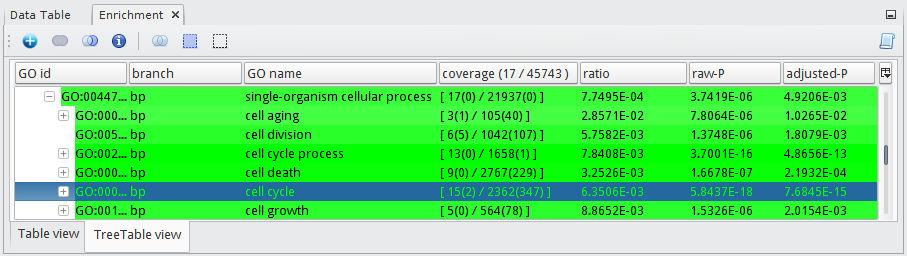
- After clicking the group node named
cell cycle, edit its visual properties in the Editor window.
- Set Font to
Droid Serif 100 Bold.- Set Text Color to
Blue.- Set Shape to
Rectangle.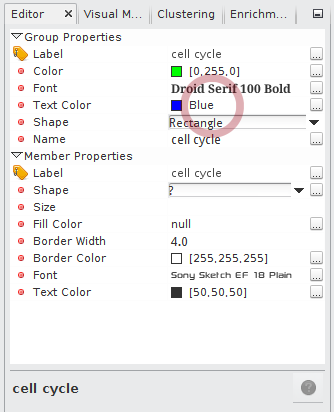
- Now you can see that
cell cyclecontains all genes inkinase binding. The final result looks like below: