2.7. Import expression profiles for 4 GBM subtypes
Now overlay average gene expressions in GBM patients of 4 subtypes onto the GBM-altered network.
- Select the original GBM-altered network tab named
tcga_gbm_edges. - Select .
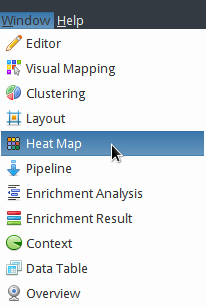
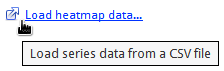
- In the just opened Heat Map window, click the Load heatmap data... label.
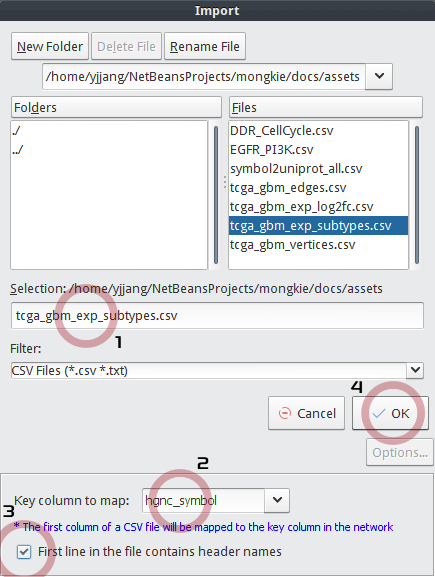
In the Import dialog,
- Choose
tcga_gbm_exp_subtypes.csvfile to import. - Make sure that Key column to map is
hgnc_symbol. - Be sure to check First line in the file contains header names.
- Click the OK button.
- Choose
Now your screen looks like the following:
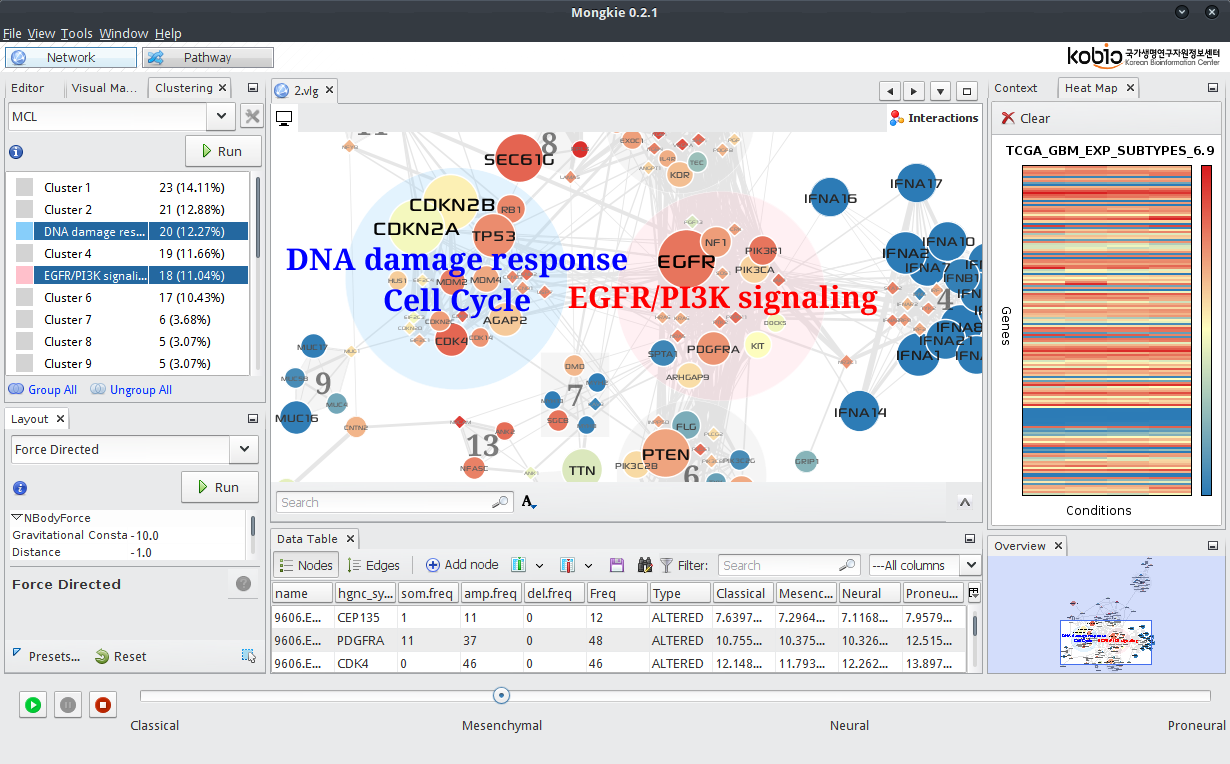
- In the bottom panel of application,
- Drag the slider tick to Mesenchymal to see average expressions in patients of
mesenchymalsubtype. - You can switch subtypes automatically to see animated pictures by clicking
 button.
- Drag the slider tick to Mesenchymal to see average expressions in patients of
Tip
You can clear the heatmap and mapped colors in the network by clicking ![]() button in the Heat Map window.
button in the Heat Map window.