2.5. Import expression log2FCs in normal vs. tumor
You will import gene expression log2FCs between normal vs. tumor condition in all TCGA GBM patients. and map them to the colors of nodes.
- Select the Network tab of previously created network from
Cluster 3in the original network.
- Select .
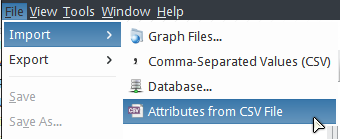
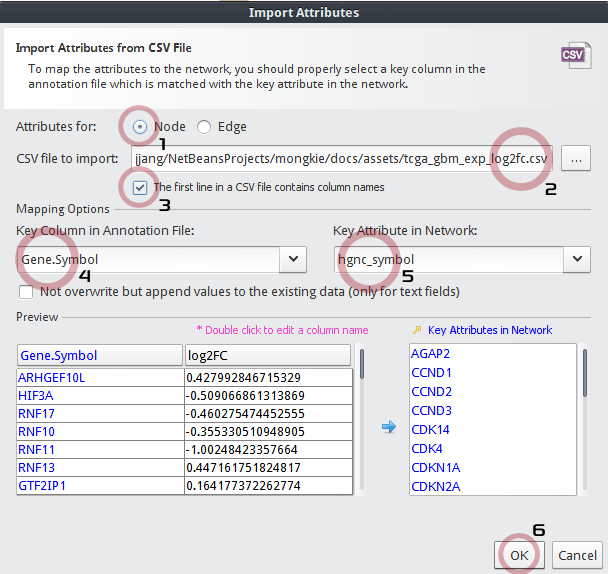
In the Import Attributes dialog,
- Be sure Attributes for:
Nodeto be checked. - Choose a CSV file to import:
tcga_gbm_exp_log2fc.csv - Check The first line in a CSV file contains column names
- Key Column in Annotation File:
Gene_Symbol - Key Attribute in Network:
hgnc_symbol - Click the OK button.
- Be sure Attributes for:
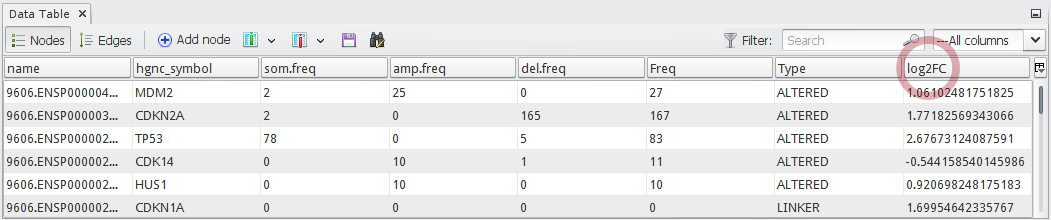
Now you can see a newly added column
log2FCin the node table as shown in below:
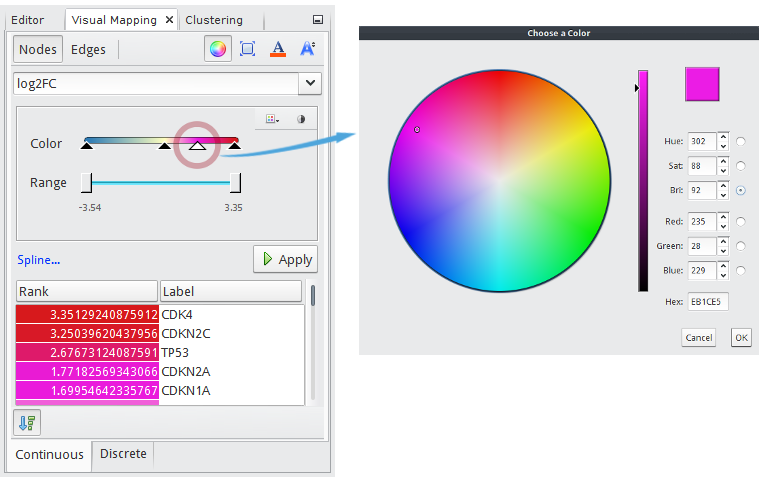
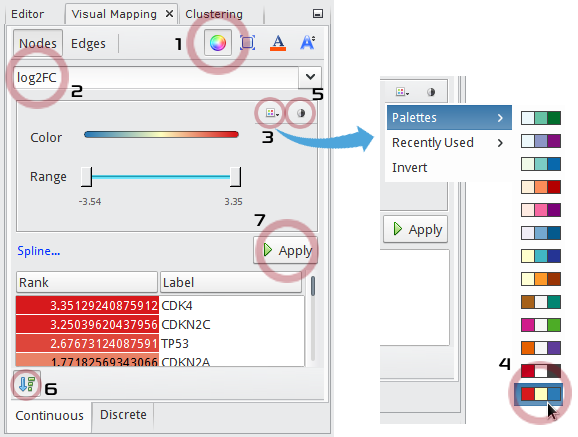
In the Visual Mapping (Nodes) window,
- Click
 icon.
icon. - Choose
log2FCin the drop-down list. - Click
 to show up a palette chooser.
 - Select
 (Red-Yellow-Blue).
 - Click
 to map
 Redto the maximum andBlueto the minimum value. - Check
 to show a list of node names with their mapped colors ranked by values.
 - Click the Apply button.
- Click
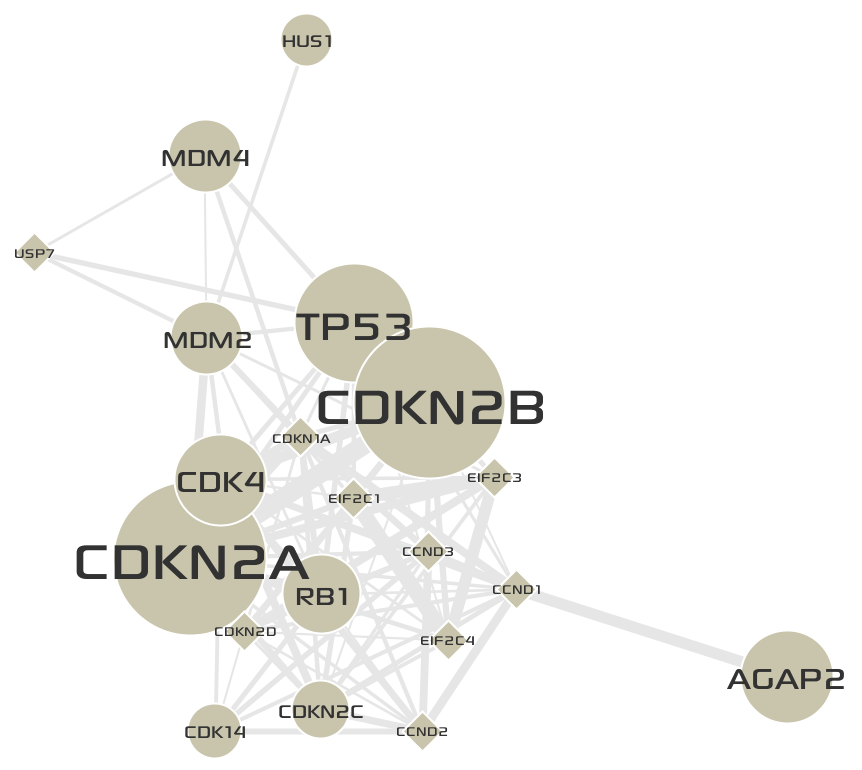
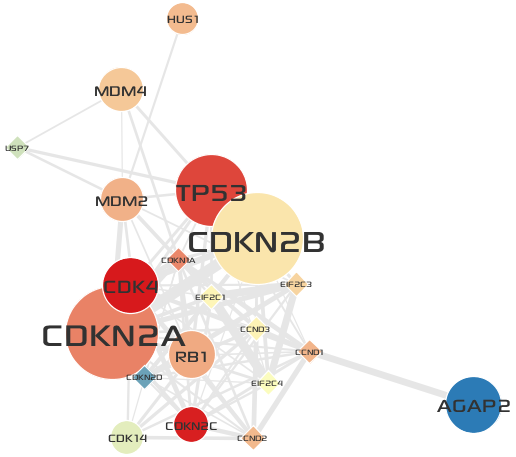
The final network of
Cluster 3is shown below:
- Repeat above steps on the network of
Cluster 5.
Tip
How to add more gradation points and colors.
- You can add any number of gradation points by clicking desired positions on the color bar.
- Once you have a gradation point, you can edit its color by double-clicking the point.
- You can also move the points by dragging them.