4.1. Visual representation of biological entities and interactions
Graphical representations of biological networks includes how to intuitively visualize a set of connected nodes (or vertice) corresponding to biological entities, including genes, gene products (protein, transcript factor, miRNA, etc.), small molecules (compound, metabolite etc.), protein family and complex, and their links (or edges), such as physical or genetic interactions, regulatory events (transcriptional and translational activation or inhibition, phosphorylation, etc.), co-expression, shared protein domain, complex formation, trans-location and other biochemical reactions.
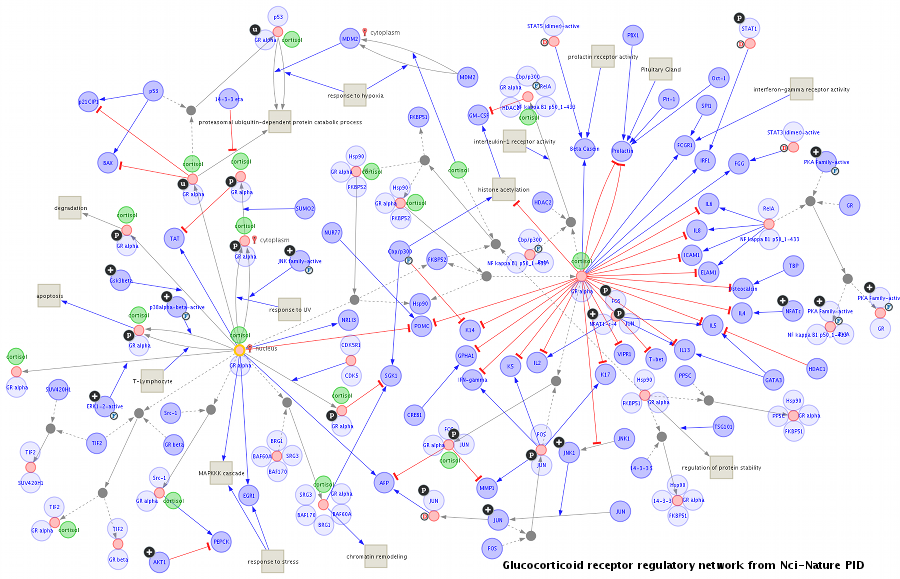
Fig. 4.1 An example of visualization of biological networks
MONGKIE provides the sophisticated data models for visualization of biological networks with advanced graph drawing techniques, and therefore can represent different types of biological entities and interactions between them with out-of-the-box visual styles, shown in Fig. 4.1. Both nodes and edges differ in their style according to their biological meaning. The style of nodes - e.g. label, font, shape, color, size and icon image - shows the type and state of biological components, and edges linking a relation participant with the information about the role also differ in their style - e.g. shape or thickness or color of lines, shape or color of arrows as well as label and font.