2.2. Data-to-Visual mapping
Data-to-Visual mapping allows you to map data attributes of nodes or edges to various visual styles.
(Optional) Before proceeding to further steps, change the default font for nodes to
Sony Sketch EFthat was used in figures in the Case Study.Note
To use the
Sony Sketch EFfont, you should download and install it on your system. It is available at here.- To open the Display Options panel, click the
 button at the bottom-right of a network display window.
 - Select the Nodes tab, and click the Font name button, and choose a font name, style, and size, then click the OK button.
- To close the Display Options panel, click the
 button at the top-right of the panel.
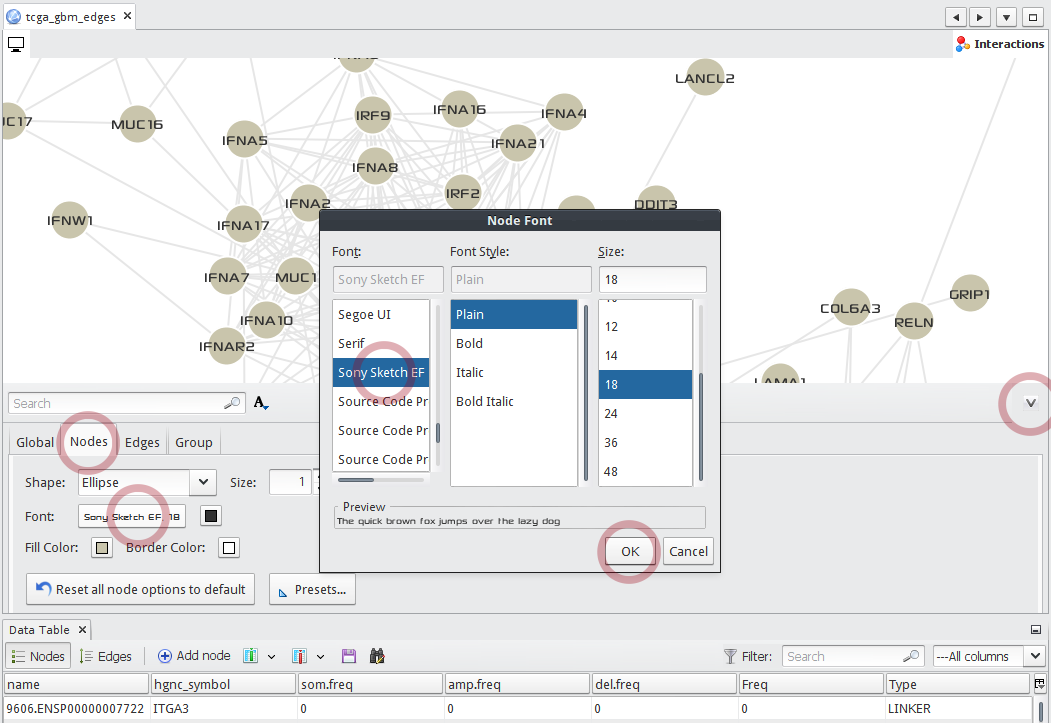
- To open the Display Options panel, click the
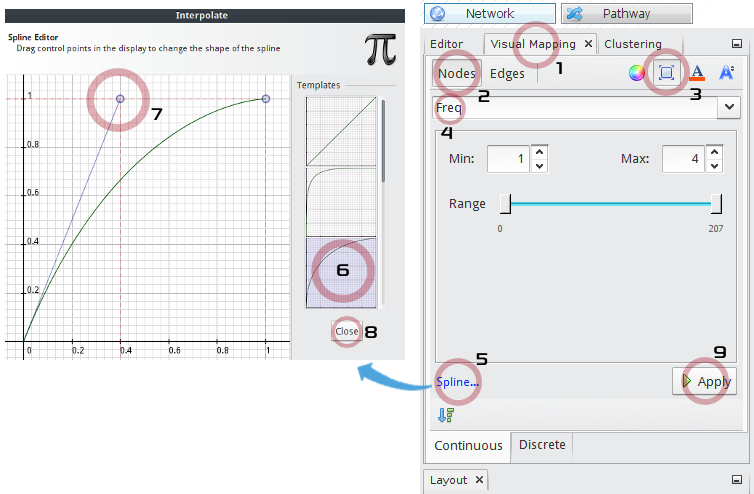
To map the alteration frequencies of genes to the sizes of nodes,
- Select the Visual Mapping window at the top-left of main application.
- Select the Nodes tab button.
- Select the
 icon.
icon. - In the drop-down list, choose the
Freqdata attribute to map. - Click the Spline... button to open the Spline Editor.
- Choose a pre-defined scale function.
- Adjust the transform scale to make more frequently altered genes be magnified.
- Close the Spline Editor.
- Click the Apply button.
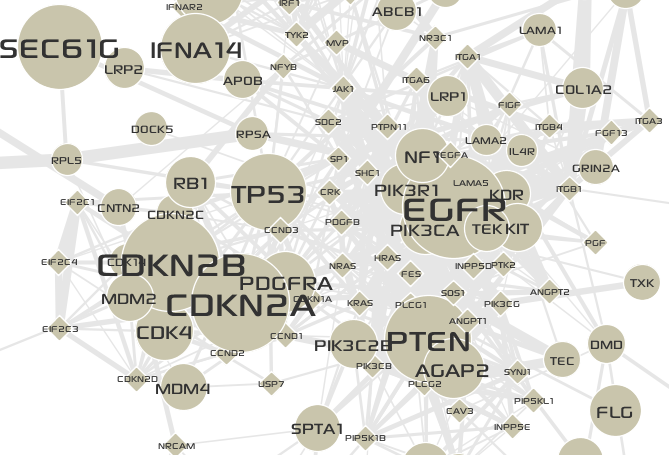
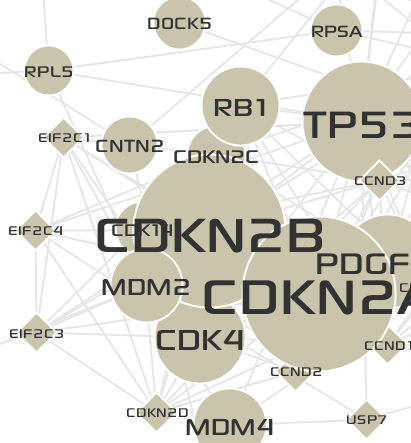
Now the network looks like the following:
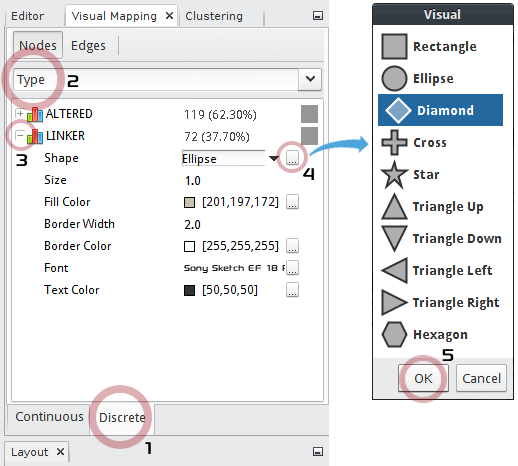
Now you will map a different shape to the linker nodes using discrete Data-to-Visual mapping.
- Select the Discrete tab at the bottom of Visual Mapping window.
- In the drop-down list, choose the
Typedata attribute of Nodes to map. - Expand the
LINKER, now various editors for visual styles will be shown. - In the Shape filed, click the
...button to show up the node shape chooser. - Choose the
Diamondshape, and click the OK button.
Now the network looks like the following:
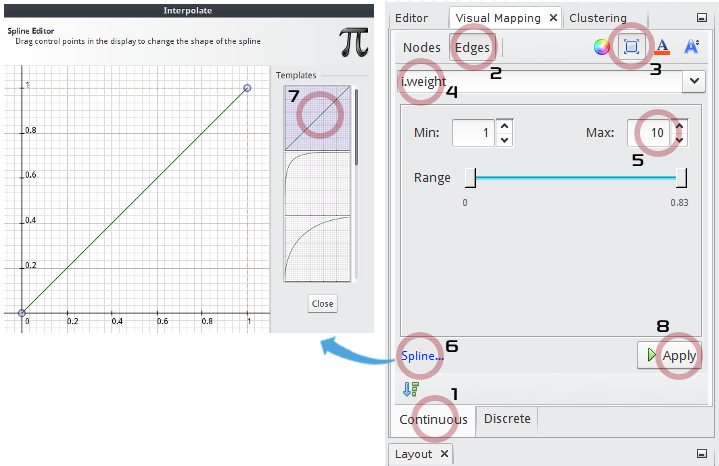
You can map expression correlations to the thicknesses of edges.
- Select the Continuous tab at the bottom of Visual Mapping window.
- Select the Edges tab button.
- Select the icon.
- In the drop-down list, choose the
i.weightdata attribute to map. - Set the Max value to
10. - Click the Spline... button to open the Spline Editor.
- Restore the scale function to the linear function.
- Click the Apply button.
The final network is shown below: