4.2. Pathway visualization
MONGKIE provides a built-in software module for pathway visualization, which supports visual analytics and exploratory studies of metabolic or signaling pathways in an interactive fashion tightly integrated with the human integrated pathway database, hiPathDB (Yu et al., 2012).
Like other types of biological interactions that can be modeled as regular binary-graphs, where interactions are between exactly two interactors, biological pathways also can be represented as a graph consisting of nodes and edges. Although these simple models have been shown to yield biological insights, biological pathways can be complex multi-modal or hyper-graphs (Saraiya et al., 2005), in which an edge could connect an arbitrary number of nodes or might connect a node to another edge. Therefore basic graph representations are incapable of modeling more complicated and interwoven biochemical reactions that involve more than two sub-components, e.g. the formation of protein complexes, and interactions that controlled by external controllers. In order to visually capture such complex biochemical events, MONGKIE presents an optimized pathway visualization based on the sophisticated visualization model taking into consideration these important domain-specific knowledges.
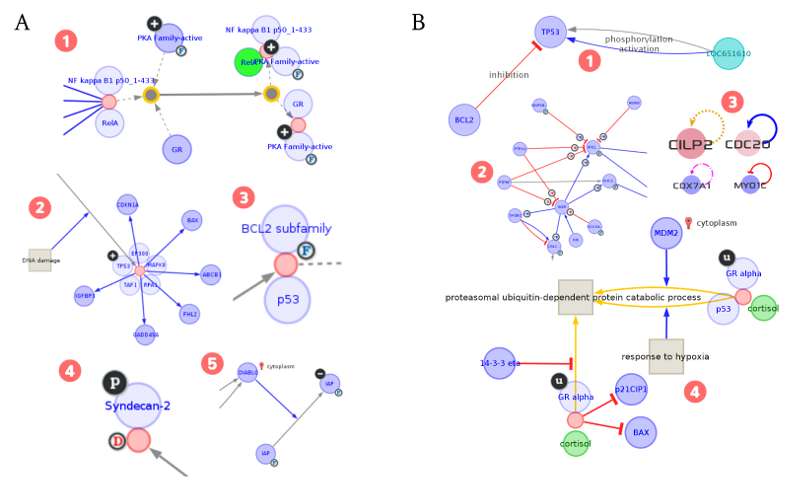
Fig. 4.2 Visual models for the pathway visualization
Fig. 4.2 illustrates how diverse types of complex components and their relationships in biological pathways are visually represented in MONGKIE. A node representing a biological molecule in a pathway visualization may be either a protein, family, complex, dimer, enzyme, other small molecules (e.g. compound, metabolites), or especially a super-node which is a hierarchically decomposed composite node representing adjacency and inclusion relationships, e.g. the hierarchical modeling of protein complex assembly can be flattened by splitting nodes representing complexes into their own individual members (see Fig. 4.2 A). An edge in a pathway visualization represents a relationship or some form of interaction between nodes. The interaction could be one of many types: complex formation, activation, inhibition, aggregation, trans-location, catalysis, chemical modification, etc. In most cases, single-line connections are insufficient to capture the whole range of information contained in a biological pathway, because biological entities are often linked by more than one type of relationship. In such cases, multi-edge networks offer the possibility to link two entities by multiple edges, in which every edge having a different meaning. Also, hyper-edge connects a node to another edge, e.g. an inhibitory interaction (edge) actually indicates a biological process by which one molecule (node) might prevent some other interaction (edge) from occurring (see Fig. 4.2 B).
All theses different types of nodes and edges in the pathway visualization are visually represented with their distinct visual styles and additional informations, including their sub-cellular location, cellular state - e.g. activated, inhibited, phospholyrated, etc. Each component of pathways have informations about the originating data source, and hyper-links to the corresponding web pages is presented at the table view to link relevant databases - eg. NCBI, PubChem, etc. The force-directed layout algorithm (Frick et al., 1999) is optimized for the virtually automatic placement of components in the pathways.